In this guide, we will be discussing some of the best charting methods that are widely used by Forex traders. The list includes: Tick charts, Bar charts, Line charts, Candlestick charts, Heiken Ashi and Renko. What’s more, we will expand on how they are used by traders.
Charts are essential in trading. They help traders better understand the past performance of any given trading instrument and predict future price movements. When trading in the Forex market, traders are destined to be met with many different types of Forex trading charts. At one glance, learning about these charts might seem difficult, but in reality, they are simple to understand. All of these different charts have their strengths and weaknesses and therefore it’s important to learn about them and choose the right one for your trading strategy.
In this guide, we will be discussing some of the best charting methods that are widely used by Forex traders. The list includes: Tick charts, Bar charts, Line charts, Candlestick charts, Heiken Ashi and Renko. What’s more, we will expand on how they are used by traders.
What are charts in Forex?
Before we discuss each Forex chart individually, let’s first discuss what Forex charts are and what they are used for. Traders base their predictions on technical and fundamental analysis. Fundamental analysis studies political and economical events such as interest rate decisions, trade balance, unemployment, elections, strikes, etc. Technical analysis studies past price movements to predict future valuation of any given currency. If there were no charts, conducting a technical analysis would not be possible.
Each trader uses different methods and strategies to analyze the markets. And therefore, what’s important for one trader, is hardly ever important for another. Different charting methods are created to satisfy the needs of different traders.
In general, charts have two dimensions: time and price. With several exclusions such as a tick chart that ignores time. Tick charts create a new bar following a tick. Different charts help analysts discover different patterns of how price changes. Patterns that give traders good risk-to-reward ratios and have a high likelihood of price moving towards predicted direction are greatly valued among traders. Different patterns are created around different charting methods.
When it comes to the usability and importance of these charts, we can confidently say that without them today trading Forex would not exist in a way we are familiar with. Even fundamental traders that ignore technical analysis, use charts to find the best entries and exits. These charts provide us with information such as price movements over time, current and upcoming trends, price ranges and more.
Types of Forex charts
As we have already mentioned, there are multiple charting methods available in Forex. It is important for traders to know what the differences are between each one of them, as each of them is used for a specific purpose. Below, we will discuss some of the most common Forex trading charts.
Tick Charts
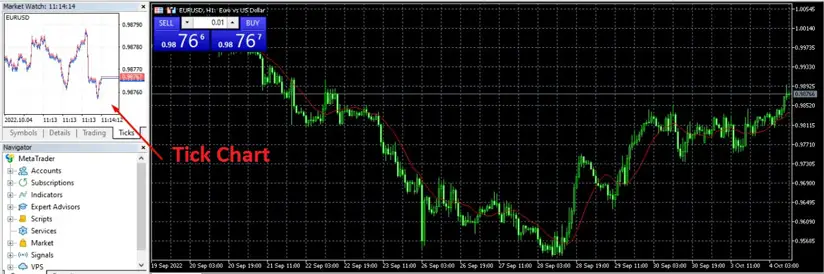
Probably one of the least recognized charts is a Tick Chart. It is an interesting chart that draws bars based on the transactions that were made. Therefore, while using the Tick Chart, traders can set the number of Ticks, which are also the number of transactions, that chart has to follow. So if the trader sets the chart to 5,000 ticks, the chart will draw bars for every 5,000 transactions.
Tick Charts help day traders to trade price action. The main difference between tick charts and time charts such as 1 minute charts is that ticks make new candles whenever volume increases. And therefore, ticks can make multiple candles within a minute and display price swings better. However, tick charts are not used in Forex trading very often. An obvious downside of using the charting method is that you won’t be able to spot chart patterns and candlestick patterns effectively, however, you can always use the method in combination with other charts. In the example below we can see that the tick chart is used in combination with the Candlestick chart.
Bar Chart
Bar Chart is the second chart in our guide to Forex charts. This chart follows four metrics of the trading market: Open, High, Low, and Close. Bar charts and Candlestick charts are very similar in this regard. Charts that show Open, High, Low and Close are also referred to as OHLC charts. The charting methods display fights between bulls and bears within a given period of time. And they do that highly efficiently. When looking at Bar charts, you will be able to see who has the initiative, buyers or sellers.
Bar charts are commonly used in Forex trading, however, the number is not as high as the Candlestick users.
The main advantage of using the bar chart is that you have a lot of information consolidated in a small area. Which makes analysis much easier.
Join over 25 million worldwide who have already chosen the Plus500 Group
Regulated in 7 jurisdictions. Chosen by 400,000 traders globlaly
Online trading with better-than-market conditions
Trade with spreads from 0.0 pips, no requotes, no price manipulation and no restrictions.

Line Chart
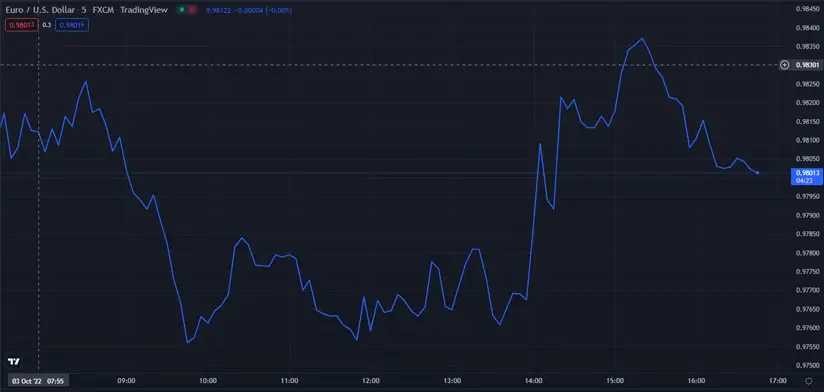
Probably the most recognizable and easiest chart to read. Line charts in Forex only showcase closing prices of an asset within a period of time. Line charts are classical and the oldest charting methods. They are also very simple and don’t display as much information in a condensed area as other methods such as Candlesticks or Bars. However, Lines are very useful for analyzing general directions. They are simply to read and for that reason, most indicators use lines as well.
- In addition to using the line charts in Forex, this type of charting method is dominant in everyday life. However, line charts are only popular for indicators in Forex.
Candlestick Chart
Using Candlesticks is the most popular charting method in Forex. They are essentially the same as Bar charts, but have way better visualization and are better to read. Just like Bar charts, these Forex trading charts also provide us with opening, high, low, and closing prices. The difference is the design in which we are presented with this information. This Forex chart is called candlestick as each bar looks like a candle.
Top and bottom of each candle represents the maximum and minimum points price have reached within a candle. Open and close prices create a candle’s body. The charting options displays how price was changing within a given time frame. It shows behavior of bulls and bears and who has an initiative. Thanks to its unique properties, Candlestick charts offer traders a chance to analyze market psychology. As a result, there are multiple chart patterns discovered by analysts. The most popular candlestick patterns are: Hammer Patterns, Bullish and Bearish Engulfing, Morning Star and Evening star, Three White Soldiers and Three Black Crows, Doji, etc.
Candlestick chart was first created by the Japanese traders, who were trading rice in the 1700s. And yes, they were making the charts by drawing them by hand. The charting method was helping traders to keep track of their sales. Later, financial traders realized the benefits of using the charting method and nowadays Candlesticks have become a standard method of charting.

Heiken Ashi
Heiken Ashi is the Forex charting method that is mostly used by professional traders. Traders use the Heiken Ashi in combination with other charting methods as it uses average prices. In this regard, Heiken Ashi is more like an indicator and less like a charting method. The candles formed on this chart are more uniformed. The line and visualization get smoother, as one-off drastic falls and rises are not so obviously visible. This makes trend riding easier as bigger chart patterns are easier to spot when using Heiken Ashi. However, if you are not familiar with the chart and don’t know where to use it, it is better to stick with a regular candlestick chart, as it gives a more detailed analysis of the market.

Renko
The last Forex chart on our list, and probably the least used is Renko. This is a Forex chart for professional and institutional traders, as it is a chart that is mostly used for analyses that consist of very large periods of time. Being the least used types of charts in Forex, Renko charts are charts that only form small boxes on the chart, when the price moves a certain distance. Renko is mostly used by day traders, swing traders and large time frame traders to spot trends, support and resistance areas, breakouts and price reversals.

The main takeaways
To sum everything up, technical analysis would not exist and trading would be much different without charts. There are various types of traders and they use different trading strategies. Each trader has different needs and to satisfy their needs, there are various charting methods developed. Some of the most popular charting methods are: Tick charts, Bar charts, Line charts, Candlestick charts, Heiken Ashi and Renko. Tick charts make new candles as a certain amount of transactions take place, therefore, they are not time bound. Bar charts and Candlestick charts show open, close and maximum prices changes within a given candle. Candlestick charting method is the most popular among all kinds of traders. Heiken Ashi and Renko are generally used by professional traders and they are usually used in combination with other charting methods. Line charts are the oldest and the most widely used charting methods in everyday life. However, lines are usually used in indicators and line charts are not very popular in Forex. Learning about different charting methods can help you find the method that best suits your trading style.
FAQs on Forex Chart Types
What chart is best for Forex?
Each chart type is unique and gives traders different visual information. The best charting method is the one that best suits your trading style and strategy. That being said, candlestick chart pattern is one of the most popular charting methods as it helps traders see market psychology.
What are Forex charts?
Forex charts show price movements of currency pairs graphically. There are various charting methods developed in order to better analyze the prices. Some of the most popular methods are: Tick charts, Bar charts, Line charts, Candlestick charts, Heiken Ashi and Renko.
How do you read Forex charts?
It depends on the chart type. Tick charts put emphasis on the price action. Line charts show prices as a single line. Bars and candlesticks give traders information about candle open, close and extreme points. In order to better read the bars and candlesticks, there are various price patterns developed. As a result, candlesticks are the most popular charting option. In addition, there is Heiken Ashi and Renko. Renko is used to reduce noise and better analyze specific changes in price.


